In the previous installments, I discussed ISO21501-4 (a standard used during particle counter calibration for the cleanroom industry) and how it served to bring a degree of rigor to air quality measurements in the cleanroom and manufacturing industry. In this installment, we’ll discuss particle mass (PM) estimation in air quality instrumentation.
First of all, let’s look inside some simplified air quality sensors to see how they function. There are two main types of optical air quality sensors: optical particle counters and optical photometers. A general overview and discussion of the limitations and challenges for each type of sensor follow below.
Optical particle counter
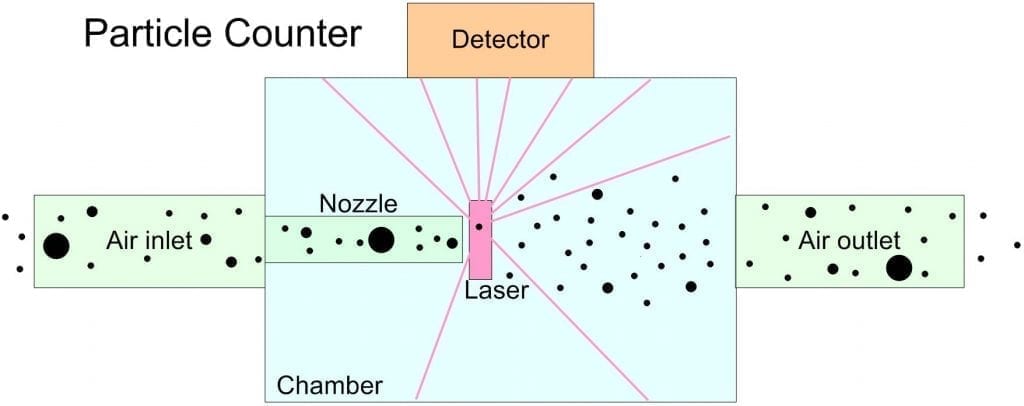
In the case of an optical particle counter, the sensor estimates air quality as follows:
- The air enters an inlet which reduces the flow to a thin high-velocity stream of particles,
- On exiting the nozzle these particles pass through a beam of focused light one at a time (ideally),
- As each particle passes through the beam it scatters photons in all directions,
- Some of these scattered photons will directly hit or be reflected onto the photo-detector,
- The number of photons that reach the detector is closely correlated with the size of the particle, (assuming that they pass through a beam with reasonably uniform intensity at a reasonably uniform velocity),
- A photo-amplifier amplifies and converts the signal from the photo-detector into a voltage pulse,
- The amplitude (or height) of that voltage pulse is indicative of the particle size,
- Sensor electronics bin these pulses by size into separate channels, and keep a count of pulses in each channel,
- These channels are configured during a calibration process where particles of known sizes are used to establish the pulse height threshold for each channel,
- Periodically these channels are read and reported, indicating particulate counts by size over a user-defined sample period,
- Using the elapsed sample period these counts can be easily converted into estimates of particle concentrations by size within a volume (e.g. cubic-foot, or cubic-meter),
- To estimate particle mass, average size is attributed to each channel and then that size is used along with estimates for particle density and refractivity to determine an estimated mass for one particle within a channel,
- The estimated mass for each channel coupled with the previously determined concentrations for each channel allows us to then estimate total mass by channel and then to group various channel masses to form more common mass measurements like PM2.5 etc.
Some of the challenges with estimating particle mass from such a sensor are:
Manufacturing standard: If a sensor pass passes ISO21501-4 it ensures a reasonable level of performance for this sensor. Sensors that are not ISO21501-4 compliant can have serious challenges in reporting accurate particle counts and hence providing any reasonable estimation of particle mass. Some 3rd party studies have shown very poor results for many of the low-cost “particle counter” type sensors being provided for the indoor air quality industry.
Coincident particulates: ISO21501-4 requires manufacturers to state the maximum concentration the sensor can operate in given minimal coincidence (i.e. more than one particle passing through the beam at a time). The user can then determine whether this meets the requirements of their expected environment and expect reduced accuracy when an environment that exceeds this stated threshold is encountered.
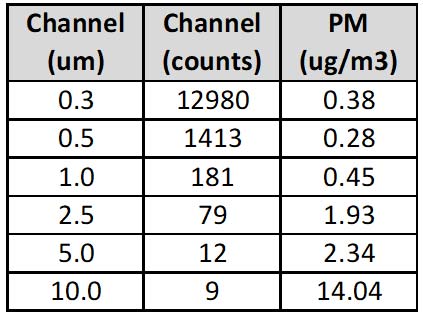
Size estimation: This is a critical factor in determining mass. Since the volume of a sphere is the cube of its diameter it’s imperative that we arrive at a reasonably accurate estimation of the actual size of all of the particles we see. The table on the right shows an example of PM calculation by size for a 6 channel sensor. For the sample period this sensor saw nearly 13,000 particulates in the 0.3um channel and only 79 particulates in the 2.5um channel, yet, the estimated mass of the 2.5um particulates in the 2.5um channel is more than 5 times as large. It has a huge impact on the quality of this estimation and so the more accurately a sensor can estimate the size of particulates the more accurately that sensor can estimate particle mass for particulates in a channel (or multiple combined channels, as in PM2.5).
Other factors: When estimating mass a number of factors impact this estimation. The density, refractivity, and even the geometry of particles passing through the sensor can impact the mass estimation. As you might imagine a dark, and very dense particulate will have a much lower mass estimation than a less dense and paler particulate even if they are of identical size. Typically the sensor allows the user to apply a correction factor to account for this, that way if the user knows something about their environment (e.g. gypsum production plant vs. a coal mine) they can take gravimetric samples and add the correction to the sensor to account for such a variation (if this is desired). High relative humidity can also have an effect on particulates. They can act like seeds and absorb moisture growing in apparent size within a sensor. This is more pronounced outdoors in high-humidity environments. In such environments, heaters can be installed on the inlet to attempt to remove the moisture from the incoming air stream in an attempt to improve sensor accuracy.
Optical Photometer
In the case of an optical photometer, the sensor estimates air quality as follows:
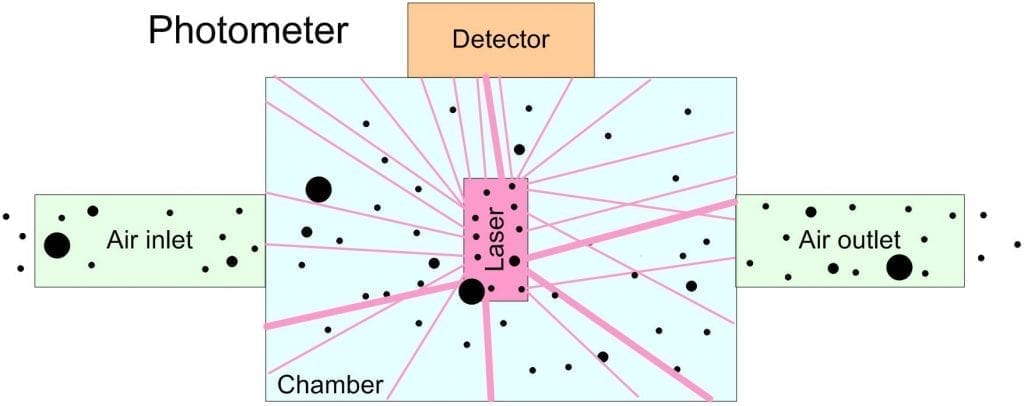
- A much larger inlet allows air into a chamber,
- The air passes through the chamber, some of it passing through a beam of light within the chamber,
- Particulates passing through the beam scatter photons, though in this sensor there are many particulates in the beam at the same time,
- Some of these scattered and reflected photons will hit the photo-detector,
- The detector collects an “aggregate” reading for ALL the particles it is currently “seeing” over some period,
- The detector takes that reading and compares it to readings obtained during a much cruder calibration process and assigns that reading an estimated mass,
Some of the challenges with estimating particle mass from such a sensor are:
Manufacturing standard: As noted in previous installments, at present there is no manufacturing standard for such sensors, and most of the offerings targeted at the air quality space make use of a sensor that is only marginally better than a random number generator.
Calibration: Aside from inherent issues in the design of many of these sensors, the calibration process for these can also be an issue. The calibration typically relies on a reference instrument (with no requirement as to its traceability) providing a “measure” of air quality for the air in a large chamber. A poorly controlled amount of particulates are added and typically agitated within that chamber (i.e. some dust is added and blown around by fans) and a large number of sensors are connected to the chamber with the reference instrument. The value on the reference instrument is then used to “calibrate” all of the sensors, based on the value they are currently seeing. In such a system it’s doubtful that repeating the process with a sensor would yield the same or similar calibration value.
Size and count estimation: At the root of the issue is the challenge of truly estimating the number of particles or estimating their size distribution.
- There are no size bins the reading is the aggregate of the total scattered light over some sample But, a handful of smaller particles in the beam can scatter a similar amount of light as one larger particle, but as we saw in the table above the mass estimation difference between smaller and larger particles (since mass is the cube of the size) is enormous, so it’s impossible to get a good mass estimation without having some idea of the size distribution. The most expensive photometers have either manual or automated means of excluding larger particles from the air stream (e.g. impactors, cyclones, etc.) in an effort to better control the size distribution of particles they are measuring. But, it’s a crude tool at best and doesn’t provide any size distribution for the particles you are measuring, and none of the low-cost photometers have even this rudimentary ability.
- It’s impossible to control the uniformity of a beam of light over a large area within a chamber (in a particle counter the alignment is critical to within a few microns!). So some particles will pass through a more intense area of the beam, while others will pass through the beam’s fringes, while still others will miss the beam entirely. You can argue that this will average out, but since there is no uniformity to the particle sizes, and since there is such a huge impact from size on estimated mass, there would be a significant variation in estimated mass if we passed the SAME air through such a sensor multiple times.
- Airflow velocity is important in particle counters since the amount of scattered light is directly related to the speed of the particle passing through the beam and the beam’s intensity. In these sensors, because of the design of the chamber there is a large velocity gradient to the air moving through the chamber. Like a river where the water in the center of the stream is typically moving much faster than the water along the banks, the air in the center of the chamber is moving much faster than the air along the walls. So, slower particles passing through the beam will scatter more light than faster particles of the same size.
- Airflow laminarity (a measure of how linear the airflow is between the inlet and outlet) is important as well. The velocity gradient mentioned above and the geometry of the chamber creates eddies within the air flow so that some of the particles will recirculate through the chamber and get counted multiple times. To make matters worse, these eddies are much slower and so these particles will scatter much more light on subsequent passes than they do on their initial pass through the beam. Some particle counters we have the means to exclude these from being counted, but there is no such mechanism possible in a photometer.
Other factors: As with the particle counter the same external factors: particle density, refractivity, geometry affect the conversion of scattered light into an estimate of particle mass (i.e. if the sensor is measuring particles different than the ones it was calibrated with, we’ll get different values for estimated mass). And, typically many of these sensors have no means for adding a correction factor. Also, the same issue applies for relative humidity and again there is seldom an option of adding a means of controlling humidity with these sensors.
Coincident particulates: One of the cited strengths of this architecture is that such a sensor is able, in theory, to operate in environments with higher particle densities. Since only an aggregate count is seen (i.e. we’re not measuring every particle) the electronics are much simpler and there is very little processing required to yield a result (e.g. periodically just read the value on the detector and convert that to a PM value using a “calibration” factor). However, the reality is that in order to measure both a very clean environment AND a very dirty environment with the same sensor the actual dynamic range (the difference in the amount of light seen at the detector) is enormous. A very clean environment will have very few particles transiting the sensor and scattering precious few photons while a very dirty environment in such a sensor will create a standing cloud of particles in the beam which typically saturate the sensor. And, since there is no manufacturing standard or credible test for performance of these, even if these sensors were accurate there’d be no way to specify the accurate working range for one of these sensors. And, though some of these sensors claim to be able to detect ultra-fine particulates 0.2um and smaller, they only do so in aggregate (they look at the sum of the photons scattered), so they only start seeing the faintest of readings if MANY such particles are present and in such a case the figure they gather is hardly representative of the population that may actually be present.
The sad truth of optical photometry in air quality products
If the above is the case, then how do these sensors perform so well in the field? It doesn’t seem like it would be possible for so many of the sensors scattered across a geographical area to agree on air quality if the above were the case. The above perplexed me some as well, and the reality of what has become common-place for “low-cost” sensors in this industry is quite shocking. Below are some of the methods these sensors use to attempt to improve their measurement accuracy.
- As noted the best of these sensors use a system of size selection schemes (automated or manual) to attempt to create a size distribution with which to inform their mass estimation. At the upper end of the price scale, this improves the accuracy significantly but they still have all the other challenges associated with this architecture but it is a reasonable attempt at improving measurement accuracy.
- Reference instruments are often qualified away from pollution sources (outside a city for example) in order to use the expected background levels as a means of achieving the desired accuracy. That’s great if all your measuring is reasonably clean air away from the area you truly care about. But, it doesn’t reflect the reality of the environment and conditions you want to ultimately monitor and function within.
- Normalization and post-processing in the cloud. This is truly egregious. Some sensor networks push up all their raw data and perform some normalization algorithm in the cloud and then push a processed value back to the sensor for local display or display that processed value on the cloud. So, when all the sensors in a geographical area largely agree on the air quality, it’s not a fluke that this is the case or a measure of how good these sensors are, it’s a function of the smoothing algorithm that’s used to turn bad data into apparently good results.
In some of these cases, these algorithms rely on a reference instrument located in that geographical area to provide the bulk of the reading and then slightly altering that reading based on the local sensor reading. The words sound good in a sales talk perhaps, with words like normalization and post-processing in the cloud lending an air of sophistication and technology to the offering. But, if we look at what’s actually being done it becomes less much less appealing. Who would stand for the temperature sensor in their home going out to the cloud to ask what temperature other sensors in the neighborhood thought it was and then adding or subtracting a bit from that value based on the local sensor to arrive at an estimate for the local temperature?
You can argue that outdoor air quality is really homogenous, so doing “normalization” in that case improves performance. If that’s the argument then why not simply download a smartphone app to get the value directly from a reference instrument located nearby and ignore the local sensor entirely? This would be a much more transparent, and likely a more accurate, implementation. And, it’s not even worth discussing how poorly such a system works for indoor air quality measurement.
How did we get here and where do we go from here
So, how did we get here? Well, as we saw in previous installments, air quality measurement arose out of a need to control manufacturing environments in the cleanroom space. The companies that served this market created sophisticated instruments to measure in many cases handfuls of tiny particulates. Over time these grew to be rather complex and expensive instruments.
The commercial and residential air quality space by contrast needed products that were much lower in cost and much simpler for the average user (not an air quality expert) to use. So, sensors were cobbled together that gave some measure of air quality, however crude, since something was better than nothing. I’ve heard that phrase repeated many times to explain the current state of sensors in this space. And, the reality it’s true in cases where you understand the accuracy of the data you’re getting and make allowances for the uncertainties when you make decisions based on that data. However, when your sensors are flat out lying to you and guessing at what the air quality might be based on data from external sources at best very poorly related to your sensor then inferring anything from that data puts you at great risk of making the wrong decision.
The purpose of this article isn’t to run down particular companies or products, as you’ve likely noted I haven’t mentioned any company by name. To date we’ve had in-depth discussions with most of the companies offering products in this space globally. Nearly all of them are well-intentioned and trying to do the best they can for their clients with what they have. Most are eager to hear about and evaluate new technology with an eye to improving their products for their clients.
We’re at an exciting time in this industry. We’re seeing huge growth as an industry and air quality is increasingly on everyone’s mind and being considered. The readers of this publication are largely the stewards and experts in this space and as such it’s our responsibility to help shape and guide progress in measurement so that we improve the quality of our measurements and make them as accurate and reliable as we can. In doing so we can safeguard the health and well-being of those who rely on us and the technology we use and provide.
Finally, it’s clear from multiple papers that PM measurements only tell a small part of the story and that size distribution, particularly vis-à-vis ultra-fine particles, is increasingly critical in safe-guarding health and well-being. If we’re to address to provide a means of characterizing air quality to reflect this reality it’s clear we’ll have to modify or extend what we’re currently doing to encapsulate this information. In the next installment, I’ll discuss how the cleanroom industry specifies the cleanliness of a room, with the intention of proposing we how we might measure and report indoor/outdoor air quality to provide more information than a simple mass figure.
This article, by Particles Plus, Inc.’s Chief Technology Officer Davis Pariseau, originally appeared in the March 2019 issue of Healthy Indoors magazine.
 About the Author
David Pariseau is an embedded systems design engineer with 36 years of development experience in consumer electronics, financial payment, medical devices, lab instrumentation, industrial controls, and machine design. David was the original founder of Lighthouse Associates (now known as Lighthouse Worldwide Solutions) in 1985, Technology Plus in 1995 and SinoEV Technologies in 2009. He co-founded Particles Plus in 2010 which is focused on bringing quality products into the mainstream commercial air quality monitoring space. He can be reached at dpariseau@particlesplus.com
CLICK TO DOWNLOAD THIS ARTICLE: